
America has too many schools – reads a WSJ article.
Education is the foundation of any nation. You can tell the prosperity of any nation by the infrastructure of its schools and healthcare facilities in remote areas. The free public education system in developed countries like America also builds a foundation for a more advanced higher education system. All of this leads to a chain reaction. Solid school education system, one of the world’s best higher education systems, feeds directly into progress in many arenas.
But there is no denying that America’s infrastructure was built decades ago and has not been “rethought” for a while now. As the world basks in the bright lights of digital innovation, America can leverage its digital prowess to rethink, upgrade, and repurpose its infrastructure, including school infrastructure.
The WSJ article’s focus on the fact that there are more schools at this point than needed, led me to consider using this topic as an illustrative example. Below is a portion of a graph from the article.
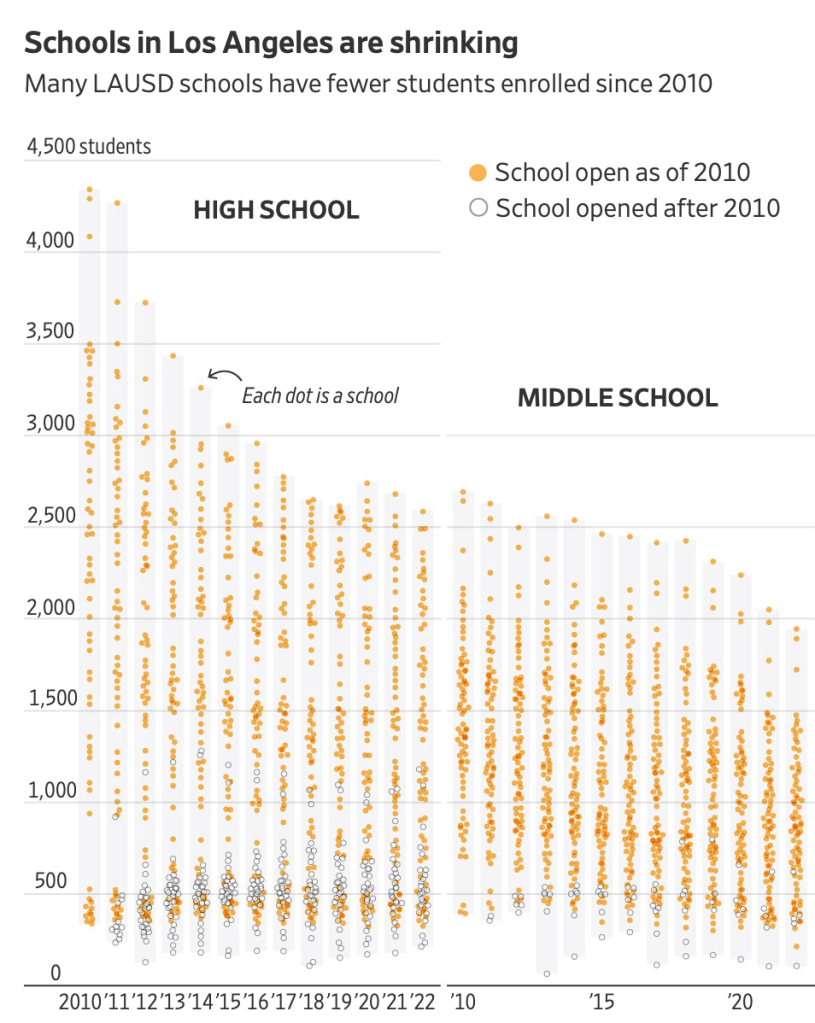
Source: WSJ: https://www.wsj.com/us-news/education/schools-closures-enrollment-los-angeles-3309c79c
The challenge here is beyond just the infrastructure question of how many schools are needed. We will use high schools for our analysis. There are many key aspects to this problem. Let us pick just one. How many schools are needed and where?
Remember that opening a school is much more than a location. Once a school has been opened, many additional elements need to be upgraded in America’s school system. However, the location is a key starting point and was also the focus of the WSJ article since there seem to be more locations than needed. The list of data points you need to solve this optimal location challenge is long. Examples (illustrative, not exhaustive) are:
- What is the demographic composition of the area?
- Where are the population clusters and how does demography differ between clusters?
- What are the current state of skills for middle school kids who will be going to high-schools?
- What are the skill deficits?
- What are the goals (trade school vs college)?
- Availability of teaching skills in the region?
- The current state of teaching expertise and skills?
- Transportation infrastructure availability?
- Minimum viable enrollments to be cost effective?
As many of you may have already figured out, this problem is similar to the classic network optimization problem of “greenfield analysis,” i.e., given certain demand locations and constraints, what are the best locations to open manufacturing plants and/or warehouses. While many of the data points in the list above may not seem similar to the typical data points in the network optimization problem, they can all be formulated into demand and constraints.
Translating these into a greenfield problem will give you optimal school locations, population assignments to schools, and teaching skills alignment. This can then be mapped with existing infrastructure to understand gaps, including whether you have schools you do not need and the optimal way to eliminate or add schools.
As mentioned, this is just one example, and it does not necessarily leverage AI. But if you have captured all the data points listed above (and some more), you can use those data points and AI algorithms to leverage this optimal infrastructure more prudently. From designing curriculum to capturing student and teacher skill progress, AI can bring a whole new level of science to school education.
It is time to accelerate the usage of analytics and AI for good!
