
In my article, Deep Learning for Dynamic Pricing, I postulated that the world of pricing can benefit from deep learning, due to the complexities involved. In this two part article, we will evaluate whether the same postulation holds also on a dataset that is relatively less complex. That is, we want to see if using deep learning will help predict price determinants better.
In this first part, we will use random forest on an E-commerce dataset. In the subsequent part, publishing on 03/27, we will leverage a deep learning model to predict determinants and reconcile results from both approaches.
Dataset
The data that we are going to leverage for our comparative modeling exercise is data for a Brazilian E-commerce company. The dataset is available on Kaggle.
This is a public dataset of orders made at Olist Store. Olist connects small businesses from all over Brazil to channels without hassle and with a single contract. Those merchants are able to sell their products through the Olist Store and ship them directly to the customers using Olist logistics partners. The dataset has a total of 100k orders from 2016 to 2018.
Data has been anonymized, and references to the companies and partners in the review text have been replaced with the names of Game of Thrones great houses.
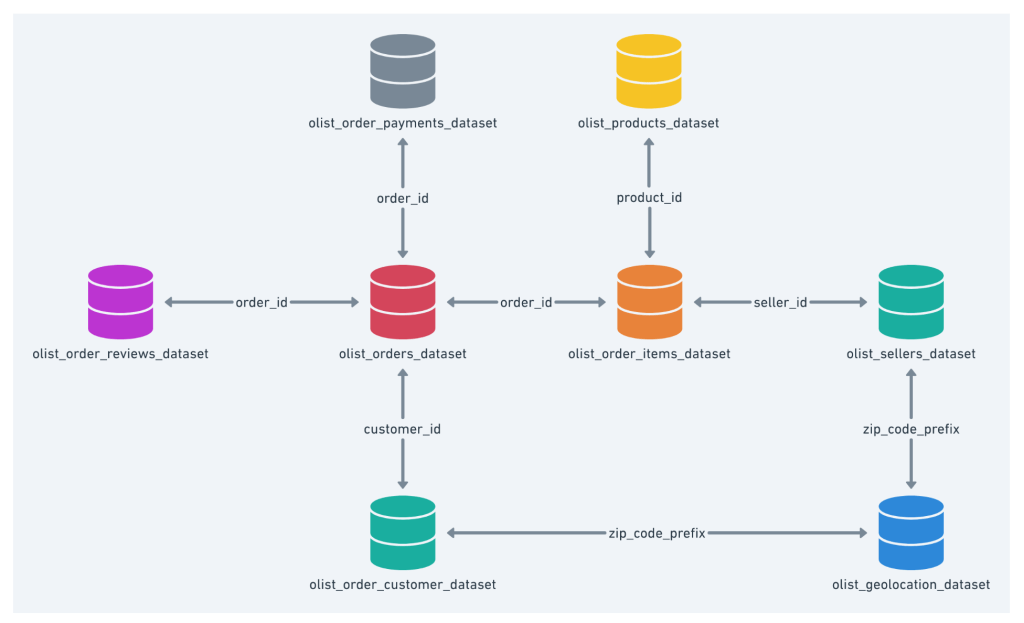
Data schema has been shown below.
Prediction using random forest
Now let us leverage this data to build a price prediction model leveraging random forest. Then in the second part of this article, to be published on 03/27, we will leverage the same dataset to build a deep learning based prediction model and then compare the results.
As you may have seen after downloading the data file, the file has multiple data files as per the schema suggested above. The files that we will leverage pertain to:
- Items ordered
- Order metadata
- Order payments data
- Product data
- Customer data
- Seller data
- Product category mapping table
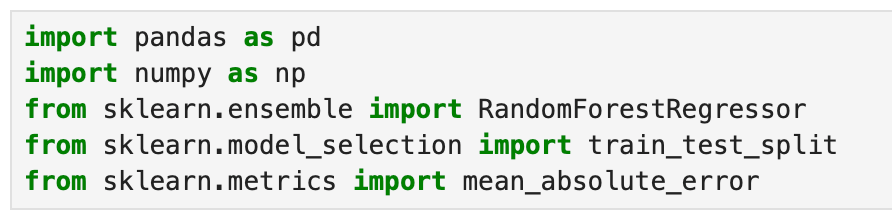
With this background, let us start building our random forest based model. We obviously start by importing all necessary libraries. As you can see, we are going to use sklearn, and the random forest regressor function in sklearn.
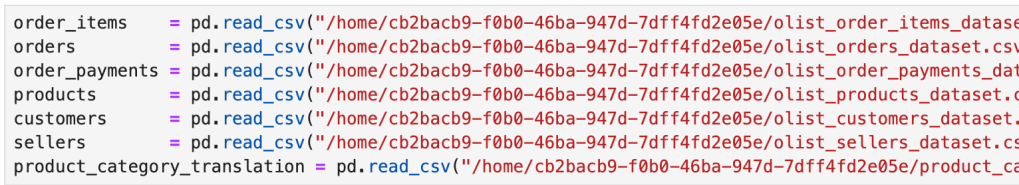
The next step is to read all the individual data files into their own data frames. Note that you will have to provide your own path to the files, based on your current directory.
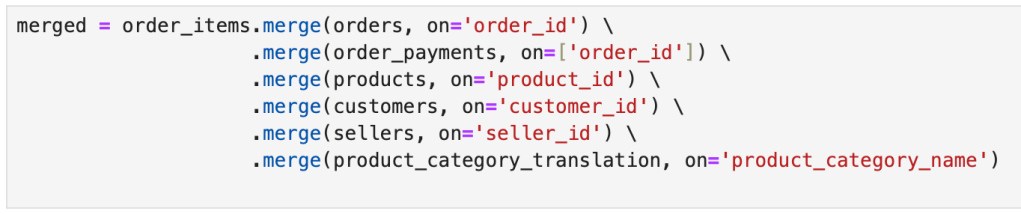
Now let us create one aggregated data frame, leveraging the schema indicated above. This will be the primary data source for our modeling exercise. We save the merged file as a css file and then read it into a data frame.


Note that a key element of any modeling exercise is spending time to understand the data. I skip that in my lessons and articles because that in itself will be a lengthy exercise, but the most important. For example, in the data wrangling code snippets, you can see how I choose certain columns only, and focus the model on top three states. As you “spend time” with your data, you will get a feel of the data, which is as critical as the building the model. For example, looking at the orders by state, both in terms of count of orders and revenue, will let you see that top three states are good enough to build the model.

Before building the model, we do some basic data cleaning and prep, as shown in the screengrab below.

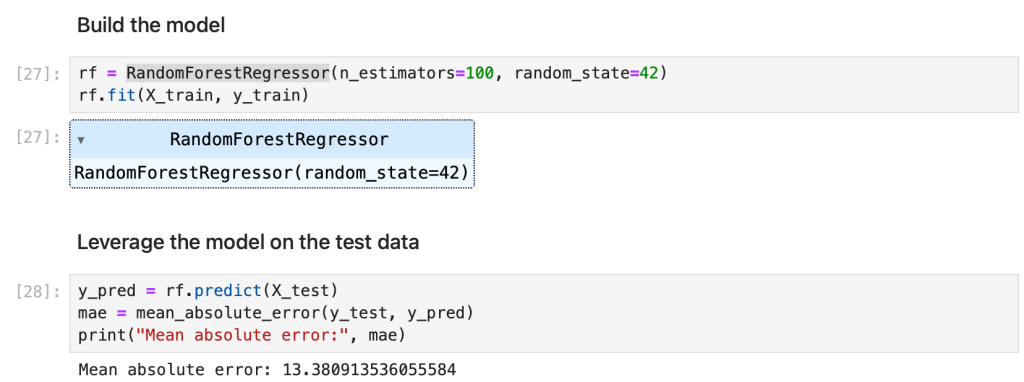
And then we build the model and calculate the error on the test dataset.
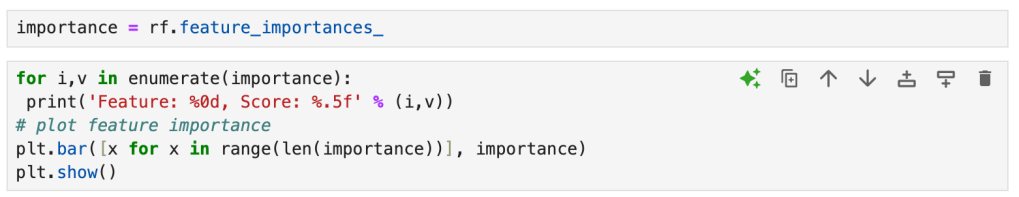
Random forest outputs feature importance, assigning scores of each feature and you can view and plot them. We will use this data in the second part for comparison purposes.
You can find the code for this part here: https://anaconda.cloud/share/notebooks/87d6a9a3-079f-409b-a731-f1c640db0080/overview
