
Past weekend, I got a chance to build a toy vector database, and then perform a similarity search in the database. The goal was to get a hands-on experience of vector databases in action and execute a similarity search. This hands-on way of peeking behind the scenes is always useful when you are envisioning use cases and experimenting with the possibilities.
This experiment was based on official documentation from the vendor. Please note that this post is not an edorsment of any product. My choice was based entirely on the ease of availability of documents and tutorials to try this. The search result returned Pinecone related links the most but I am sure other off the shelf solutions also provide these capabilities. You can refer Pinecone documents at docs.pinecone.io. The code snippets that I used were from the documentation itself. For more insights on vector database solutions, you can watch this episode of “Monday Motivation”.
Below are the high-level steps. If you like doing these nerdy things, I guarantee you will love this since I have been trying few interesting things with a couple of other vector database products that I have access to. The link to the complete notebook is at the end of the article.
Since I did not have it installed already, I installed the pinecone client first, as shown.

The next steps are to use your free API (that you can get by registering on the website), connect and then create an Index.
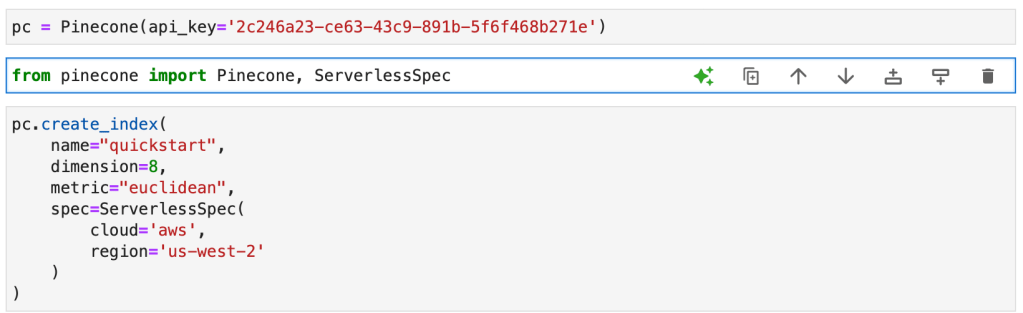
What exactly is an Index? For this specific solution (Pinecone), an index is the top-level organizational structure for vector data. The Index receives and stores vectors, handles queries on the stored vectors, and performs various vector operations within its data.
Another concept that will be useful to know is the concept of “pod”.Pods are pre-configured hardware units that host Pinecone services. Each index in Pinecone operates on one or multiple pods, and having additional pods generally results in increased storage capacity, reduced latency, and improved throughput. Furthermore, users have the flexibility to create pods of varying sizes to meet specific requirements.
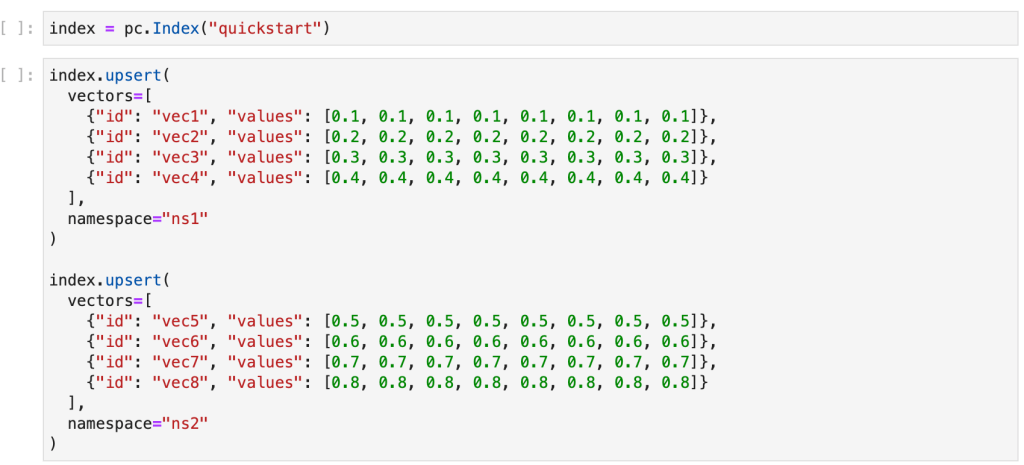
Now that we have created an index, let us initiate it and update the same with vectors, as shown in the snippet below.
As a final illustrative step, we perform a similarity search. To get an overview of similarity search method, please refer my article Leveraging Vector Similarity Beyond Search. But before that, let us run a query to overview the stats of the vectors we inserted to make sure everything looks ok.

The results you should get are:
- dimension’: 8,
- index_fullness’: 0.0,
- namespaces’: {‘ns1’: {‘vector_count’: 4}, ‘ns2’: {‘vector_count’: 4}},
- total_vector_count‘: 8}
As you can see, the vector count (in bold above) matches the number of vectors we inserted.
Now let us run similarity search.
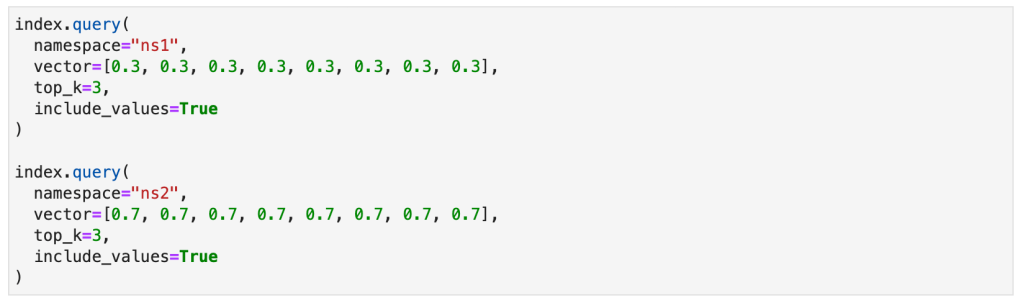
What you are essentially doing in the similarity search query above is that you are querying each namespace in the index you created for the 3 vectors that are most similar to an example 8-dimensional vector. You should get the results below:
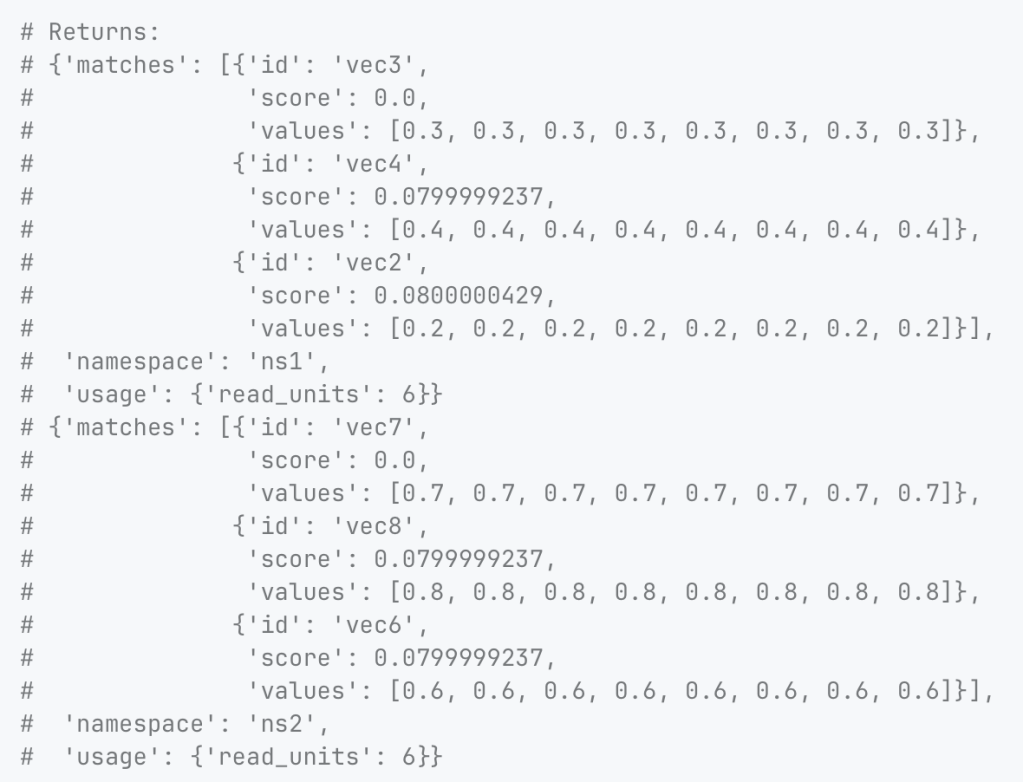
The method for “similarity” you are using is the Euclidean distance metric. This is what you specified when you created the index. The options available to you are:
- Cosine similarity. This methodology calculates the cosine of the angle between two vectors in the vector space. The scale ranges from -1 to 1, where 1 signifies identical vectors, 0 orthogonal vectors, and -1 pertains to diametrically opposed vectors.
- Euclidean distance. This measure is simpler and calculates the straight-line distance between two vectors in the vector space. The range for this method is from 0 to infinity, where 0 denotes identical vectors. Larger values indicate dissimilar vectors with higher magnitude representing more dissimilarity.
- Dot product. This methodology computes the product of the magnitudes of two vectors and the cosine of the angle between them. The range spans from -∞ to ∞. Positive values indicate vectors pointing in the same direction whereas value of 0 represents orthogonal vectors. Negative values indicate that the vectors are pointing in the opposite directions.
It was fun and interesting to get a peek behind the curtain. The reason I have a deep interest in exploring databases and their optimal architecture possibilities is because my strong belief is that if you can get the data foundation right, you have won half the battle. You can read my report, Top 5 Focus Areas For Data and Analytics, for my take on this.
You can access the notebook for the code here:
https://anaconda.cloud/share/notebooks/9f7a29fa-2b6e-444c-9f0d-08c03cd9c347/overview
