
The real value of smart manufacturing will be in the data generated by the architecture of smart factories. While some smart factory applications are pretty well known at this point and are already being leveraged by organizations, the real competitive advantage can be gained by leveraging analytics to develop capabilities that are not “conventional.” And nothing can be more “differentiating” than analytics capabilities developed leveraging the data captured by smart manufacturing solutions.
This example is from an experiment using data from an Asia based footwear manufacturing plant. The manufacturer exports a significant volume to 16 different countries. The company had recently built an automated manufacturing facility for footwear, and the line generates a ton of data.
Defining the opportunity
We know that accurate manufacturing lead times (LT) prediction significantly influences the quality and efficiency of production planning and scheduling (PPS). Traditional planning and control methods mainly calculate average lead times derived from historical data. This often results in the deficiency of PPS, as production planners cannot consider the variability of LT, affected by multiple criteria in today’s complex manufacturing environment.
In the case of footwear manufacturing, sophisticated LT prediction methods may be needed, due to complex operations, mass production, multiple routings, and demands for high process resource efficiency, as we will see in the description of the manufacturing process below. To overcome these challenges, supervised machine learning (ML) approaches can be employed for LT prediction, relying on historical production data obtained from manufacturing execution systems (MES).
Production process
At a high level, the production steps in the manufacturing process are:
- Cutting
- Skiving,
- Mounting and
- Cleaning
Every step had a different process cycle type for each product type.
Products and attributes
At a high level, five different types of product lines were being manufactured:
- Shoes
- Boots
- Top boots
- Sandals and
- Slippers
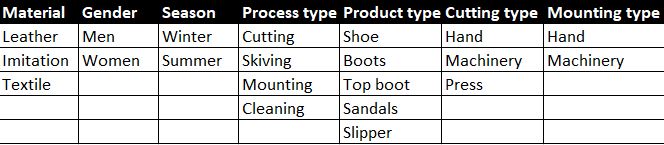
As you can imagine, the abovementioned process varied for each product and used different equipment in many instances. For instance, a high-end “hand-crafted” shoe would be cut by hand while the leather cutting machine could cut others. In addition, the mounting type can be changed between manual or automated (machine).

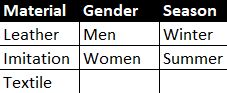
For each product line as well, different SKUs may have additional flow depending on the attributes listed below.
Data Gathering and Cleaning- Real-world challenges
I don’t need to highlight that Data gathering and cleaning will be the most challenging aspect. In this example, a significant portion of that challenge will come from the “hand-crafted” processes. Data generated by sensors is a relatively easy pluck since the primary challenge will only be cleaning and wrangling. On the other hand, in some cases, data points need to be collected manually.
After the outlier and missing data elimination, a dataset that includes seven
The Independent variable and the production time of 57,600 shoes were finalized for the experiment. The independent variables are provided in the table below and have also been identified in tables in previous sections. Production time is noted in seconds in the dataset.
Model Application
After the data gathering and cleaning step, data were divided into training and test datasets. The architecture and flow setup of the modeling process is shown in the illustration below.
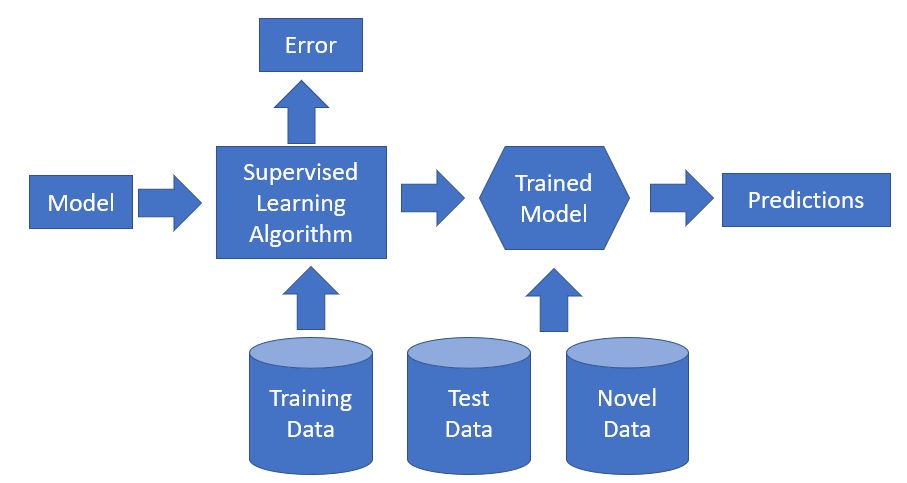
Decision Tree, K-nearest neighborhood (k-NN), and artificial neural networks
(ANN) techniques were used to train the models, and the trained models were applied to the test data set.
Results
The accuracy of the models is compared using Mean Absolute Percentage Error (MAPE) and Mean Absolute Error (MAE) metrics.

According to the results, the best performance was obtained with the CHAID decision tree model, and the essential variable was found as the process type.
This model is a classification method for building decision trees using chi-square statistics to identify optimal splits. It divides production times into bins as a dependent variable that differentiates concerning independent variables. The results reveal that the Decision Tree model best predicts the abovementioned problem.
Conclusion
As a continuous learning process, manufacturing firms need to create dynamic predictive models that update themselves according to changes in the dataset. Obviously the change in underlying data will be driven by manufacturing changes. With extended techniques that come with the evolving use of machine learning, algorithms can give better results for manufacturing analytics cases than some conventional approaches.
Also, as I have consistently mentioned in many instances, deep learning is not a good candidate for not-so-complex predictive analytics models, as we can see from the accuracy percentages in the Table above.
