
When I write these articles, these are outputs of my coding experiments and offshoot ideas from my readings. But some of these exercises or experiments are not something organizations may need to perform. Not because they are not useful but because building these models can be automated by leveraging deep learning.
So while it may be useful to understand how clustering analysis will work in a specific scenario, like supplier selection, you no longer need to develop these fragmented algorithms. By fragmented models, I mean hundred different algorithms across your supply chain or enterprise. Instead, you can develop a hierarchy of deep learning algorithms, with a master algorithm at the top, to build models for you.
Deep learning algorithms can take care of everything from data management to model development. And if someone is gaslighting you again in 2023 that this is futuristic, it may be time to look for advice elsewhere.
In this article, we explain how clustering algorithms can be leveraged in supplier ranking and selection if you are a large enterprise with hundreds of suppliers across categories. This example focuses on the selection and starts with ranking data. However, you can develop ranking groups as well using clustering.
Pre-qualification criteria
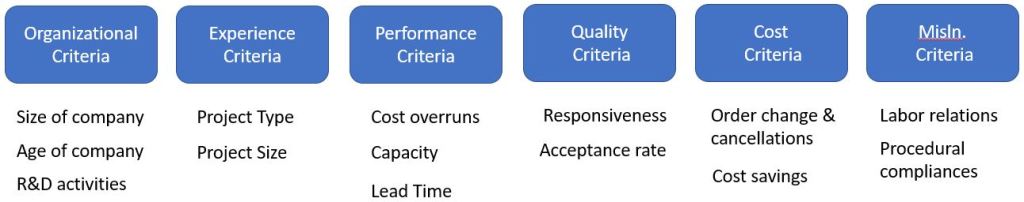
The pre-qualification criteria for Supplier ranking that the procurement manager has in mind are as shown in the illustration below:
Supplier criteria values
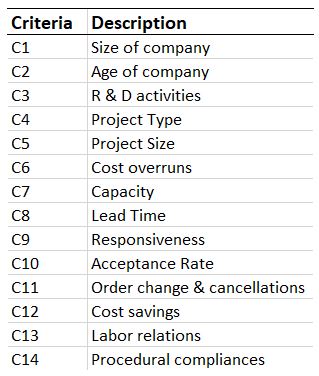
For the exercise, you can use made-up criteria data like the ones shown in the illustration below:
Generic overview of Cluster Analysis
The clustering process begins with formulating the problem and concludes with analyzing it to verify the accuracy and appropriateness of the method. The clustering process has the following steps:
- Formulate the problem and identify the selection criteria
- Decide on the number of clusters
- Select a clustering procedure
- Plot the Dendogram ( A Dendogram is a tree diagram used to illustrate the output of clustering analysis) and carry out analysis to compare the mean across various clusters
Step 1
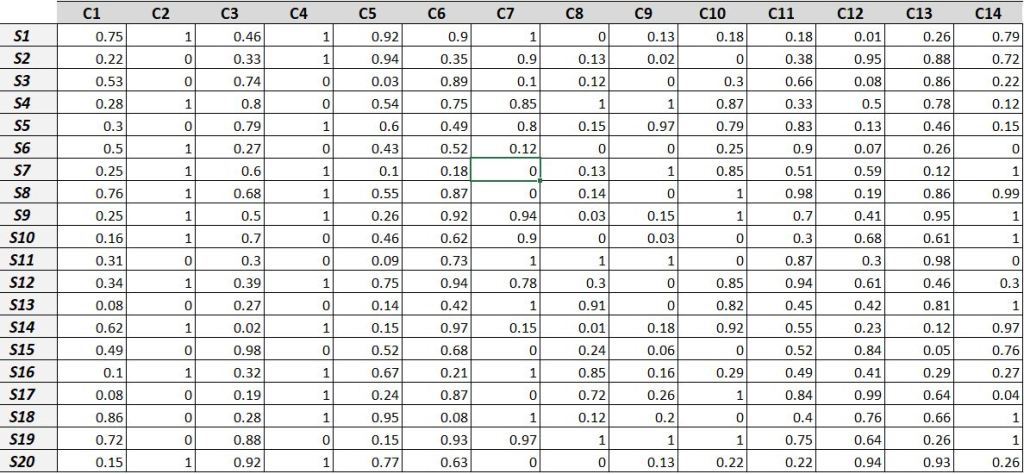
In the first step, every supplier is rated on a scale of 0-1 for each attribute, as shown in the table below:

Step 2
A key step is to determine the number of clusters. We want the initial list of suppliers to be split into two categories, good suppliers (shortlisted) and bad suppliers (rejected); hence our number of clusters is two.
Step 3
We will apply hierarchical and partitional clustering methods to supplier data in this step. We choose the method with the highest R Square value pooled over all the 14 attributes. A summary table showing those pooled values is shown below:
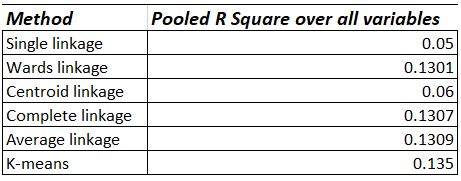
The R Square value for k-means is the highest among different methods. Hence k-means clustering method can be chosen for clustering. There are several other methods available for determining the goodness of fit.
Step 4
As a final step, we will now apply the k-means clustering. A graphical comparison of the two clusters is shown in the figure below. This graph helps us identify the cluster with the suppliers of higher mean scores. From the figure below it can be seen that suppliers of Cluster 1 have better mean scores than suppliers in Cluster 2 (on most criteria); hence six suppliers of cluster 1 are chosen as shortlisted suppliers.

