
Introduction
One of the numerous advantages of Smart Factories is the real-time visibility of your equipment’s operating parameters on the floor, transmitted by sensors. Leveraging this data optimally is key to harvesting actual benefits from your Smart manufacturing investment. In this post, we will discuss how we can apply Machine Learning methodologies to data generated by equipment sensors to detect faulty equipment conditions or diagnose the cause of the fault.
The Process
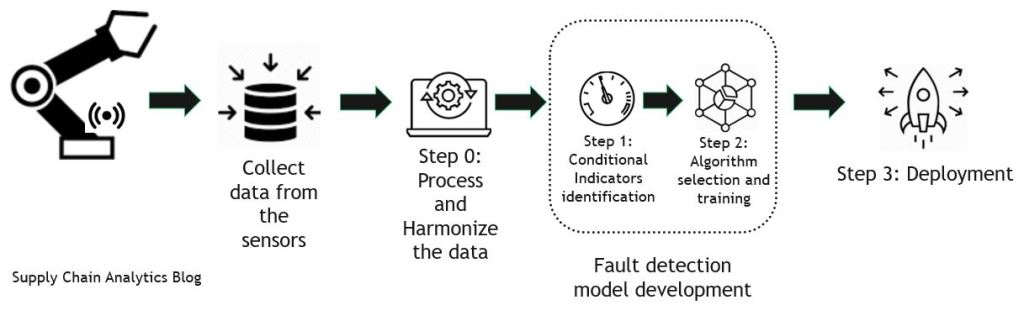
The Analytics process for fault detection is a four-step process, as shown in the diagram below. We will skip the first one, Step 0, which pertains to collecting and processing the data, and focus on the analysis portion.
Monitoring the health of your equipment
There are two aspects of fault detection:
- Determining whether the equipment is faulty or not based on specific operating characteristics
- If it is already determined that the equipment is defective, determine the source of the fault
For both of the above, the first step is to determine the condition indicators- the parameters or characteristics that will be extracted from the system data.
Step 1: Identifying conditional indicators
A condition indicator is essentially a feature of the equipment you can find in the data generated by the equipment/system. The value of this indicator changes predictably in different operational modes. In the case of fault detection, the value of the condition indicator can help distinguish a normal from a faulty operation or can help predict the remaining useful life commonly known as RUL in predictive maintenance).
An experienced modeler would explore and experiment with different condition indicators to find the one that works best. In my experience, a combination of condition indicators can better distinguish faulty and non-faulty conditions.
Some of the approaches that you can use to determine indicators are (not a comprehensive list):
- Simple metrics or values, such as the mean value of the data over time. Ex: Heat generated by a servo motor rotor
- Signal analysis, where you analyze the signal data variations over time. Ex: Frequency of the peak magnitude in a signal spectrum
- Leverage Feature selection approaches that help you reduce large data sets by eliminating features irrelevant to the analysis you are trying to perform.
One of the widely used feature selection approaches is Principal component analysis (PCA), which finds the linear combination of independent data variables that account for the most significant variation in observed values. In our scenario, principal component analysis can help us determine which features or combinations are most effective for separating our data’s different healthy and faulty conditions.
Step 2: Apply the Machine Learning algorithm and train model
Many types of Machine Learning algorithms can be applied to the fault detection problem in manufacturing, but we will focus here only on classification algorithms.
Classification is supervised machine learning in which an algorithm “learns” to classify new observations from examples of labeled data.
The definition above is just to set the context. Many online resources are available to dive deeply into classification algorithms. In the context of fault detection and diagnosis, you can pass condition indicators derived from sensor data and their corresponding fault labels to an algorithm-fitting function that trains the classifier.
For example, assume that you have created a table of condition-indicator values for each member covering different healthy and faulty conditions. You can pass this data to a function that fits a classifier model. This training data trains the classifier model to take condition-indicator values extracted from a new data set and guess which healthy or faulty condition applies to the data.
In practice, you use some of your data for training and reserve a disjoint amount for validating the trained classifier.
Some classification algorithms we can use for fault detection are below. These are all widely used algorithms, so if you want to develop an understanding of these, there is plenty of material available online.
- Support Vector Machine (SVM): Leveraging SVM, you can train a binary classification model to distinguish between two states, the presence or absence of a fault condition.
- Classification Tree: You can train a multiclass classification model using a classification tree by reducing the problem to a set of binary decision trees.
- Linear Regression: Linear Regression can help you train a classifier using high-dimensional training data. This function can be helpful when you have a large number of condition indicators that you are not able to reduce using PCA.
Step 3: Deploy and Integrate
Once you determine that the model is ready, you can deploy it in production so the algorithm can work on an actual stream of real-time sensor data.
Digital Twins are valuable because you can monitor your processes and apply advanced algorithms to the data to enhance the efficiency of your operations. Once you have significant fault detection data available, you can use it to train a predictive maintenance algorithm. We will cover that in a separate post.
